Empower
A first to market Home energy management system for solar powered homes, which automates home energy usage to provide added value for solar residences. (Think NEST but for solar powered homes)

Overview
Goal: Produce a front-end that shields users from the complexity of backend algorithms that fuel the empower product.
Role: Lead Product Designer
The client wanted a responsive web dashboard. As a Lead designer on this project, I managed a large team of 8. I worked cross functionally with a lot of moving parts including a branding team and remote engineers.
Research
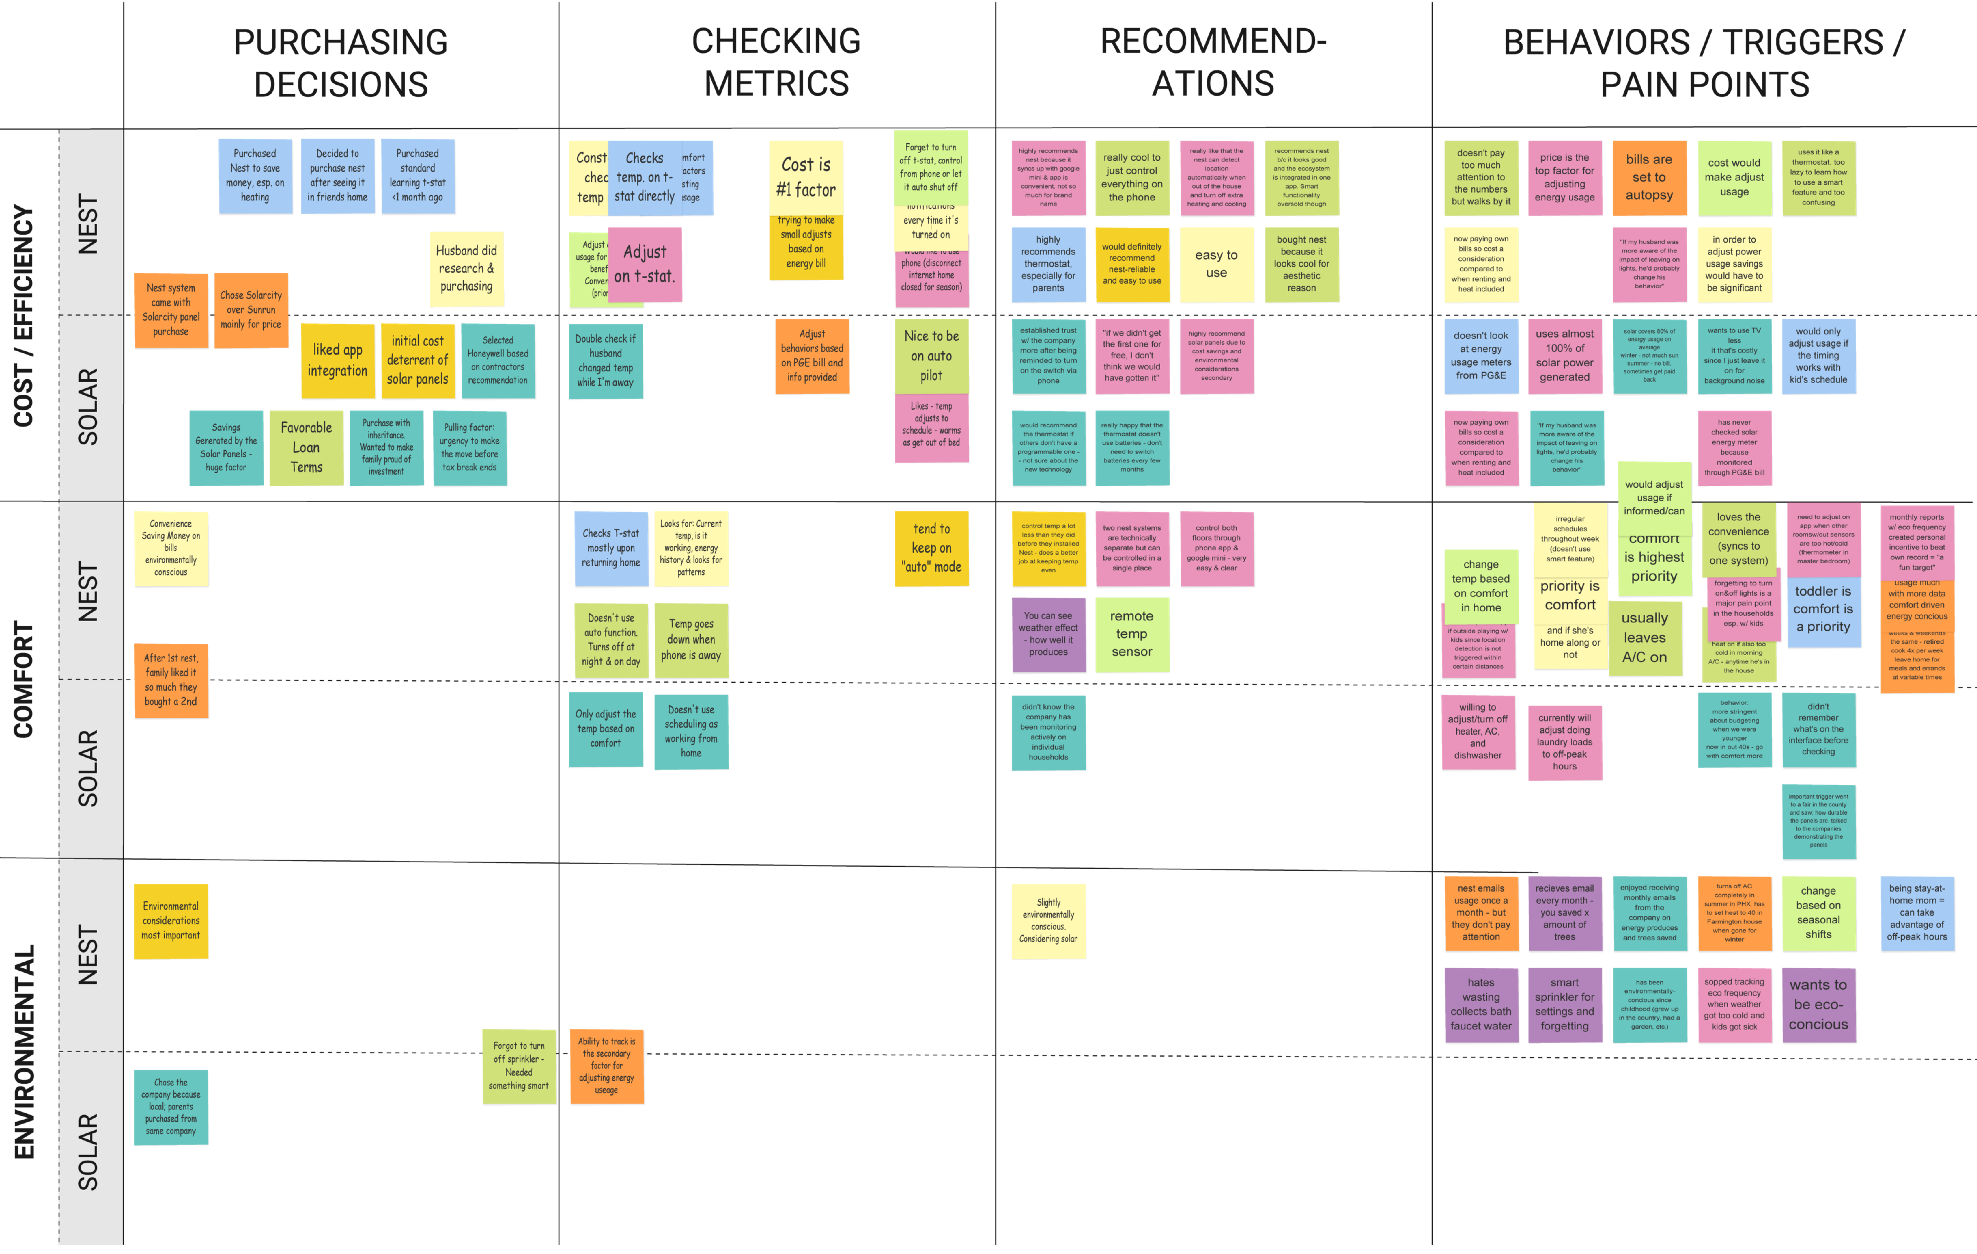
Timeline: 2 weeks
Being a 0 -1 product, research was absolutely essential in the product development process.
Research Goals were to:
- Understand the Solar energy market and laws surrounding it (net energy metering, the state of solar energy in California)
- Conduct market research to understand opportunities within the solar energy and smart home(IOT) space.
- Study the UX of similar products to assist in information architecture development, and understand optimal user journeys for users.
- Conduct interviews with users to understand typical behaviors surrounding energy usage and solar panels.

Analysis and Synthesis
Timeline: 2 weeks
Being a 0 -1 product, research was absolutely essential in the product development process.
Upon completing research, these takeaways were synthesized:
- Most users opted in on a system primarily for cost savings, as revealed through monthly energy bills.
- Users frequently checked their thermostat to see if the system was learning habits correctly.
- Users enjoy the ability to check the system via mobile device, especially when away from home.
- Manual control is especially important for families with younger children and others with irregular schedules.

Based on the takeaways from the interviews, and consulting with the client these Job stories were created to make sure the team was designing around the most anticipated use cases of EMPOWER:

with the main use cases in mind, we than started Ideation and lo-fi designs.
Lo-Fi
Timeline: 6 Weeks
To start off Lo-FI ideation I held a design studio. The only constraints were that material design patterns and components have to be used. I stressed the importance of designing with data driven decisions based on the research. Following the design studio, our team concluded it would be best to go for a dashboard layout of 6 cards.


Iteration of the dashboard overtime
I than built an Invision prototype and began testing with users. The testing with users included comprehension tests and usability testing. During testing, the main goals were to find break points in in the flow of the dashboard, as well as see what users found confusing within:
- Data Visualizations
- Information architecture and layout
- Copy within the product
(Listed in terms of Priority)
The biggest challenge during lo-fi was surrounding Data Visualization. The largest pain points uncovered During testing were that:
- Users found the circular graphs confusing.
- Having different graphs for each metric(Loads, power consumption solar production, etc)resulted in being too scattered and confusing thus leaving the product with poor IA
Knowing this, I had to design a solution to display complex data that a typical consumer would find confusing in a manner that maintained strong empathy for the average home owning consumer. The solution resulted in having a single data vis card where metrics are toggled on and off with buttons.

After continued testing and iterating over a period of month, Our team came up with a design that worked for users and satisfied the clients needs.
Branding
Timeline: 2 Weeks
While Lo-fi was running, the branding team ran concurrently. Producing designs of logos, as well as choosing fonts and colors for the dashboard.
The branding team and client and the client arrived at the empower look and feel. Which is Minimalist, Environmental, and Powerful.
The branding team and client and the client arrived at the empower look and feel. Which is Minimalist, Environmental, and Powerful.

Hi-Fi
Timeline: 3 Weeks
After branding concluded Hi-fi phase began. We ran color studies on the dashboard, mainly surrounding components in data visualization. After 3 weeks we reached a result where the client and our team were happy.
.png)

Conclusion
I was blessed to work with a super talented team, and acompany that has a very bright future. Especially with California requiring all new homes to have solar panels. While working on this project I was forced to quickly adapt and gain a deeper understanding of data visualizations under the fierce constraints that are mobile web. This project really improved my project management skills from task management of multiple designers, to keeping a constant stream of communication between teams on separate designs sprints running concurrently.
This was the one of most challenging but also one of the most rewarding experiences of my career.
This was the one of most challenging but also one of the most rewarding experiences of my career.


